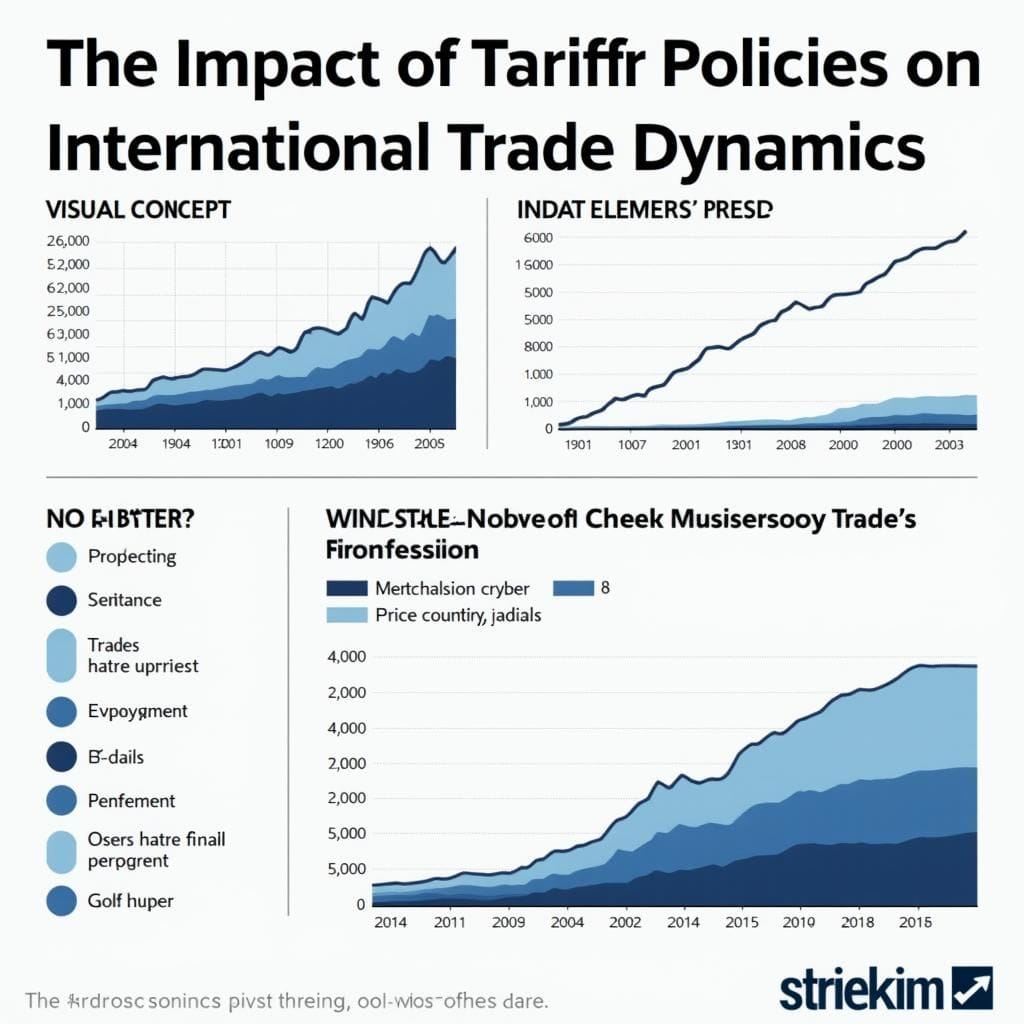
Monitoring international trade is essential for understanding how countries and businesses adapt to a constantly evolving trade landscape, including actions taken in anticipation of announced or potential tariffs. The Hamilton Project has developed a comprehensive trade tracker to track changes in international trade with the United States in response to tariff policies.
This tool consists of four interactive figures that provide data from 2018 to the present. These figures cover:
- Total merchandise trade by industry and country
- Calculated duties on merchandise imports by industry and country
- Merchandise trade price inflation by industry and country
- Total merchandise trade by principal end-use in both real and nominal dollars
Figure 1: Total Merchandise Trade by Industry and Country
Figure 1 tracks the total merchandise trade with the United States, including the value of exports from the U.S. and imports by the U.S., measured in billions of nominal U.S. dollars. Users can select specific industries, trade partners, and choose between imports or exports. They can also select the type of time series, such as value, year-over-year change, or share of total for all countries.
Figure 2: Calculated Duties on Merchandise Imports by Industry and Country
Figure 2 tracks calculated duties on merchandise imports. Users can select industries, trade partners, the type of time series, and the time period. The impact of tariff policy changes is illustrated by selecting Primary Metal Manufacturing as the industry and Canada as the trade partner.
Figure 3: Merchandise Trade Price Inflation by Industry and Country
Figure 3 displays the year-over-year percent change in the import and export price indexes (MXP) from the Bureau of Labor Statistics. Import prices are based on U.S. dollar prices paid by the U.S. importer, typically at the foreign or U.S. port, excluding import duties.
Figure 4: Total Merchandise Trade by Principal End-Use (in Real and Nominal Dollars)
Figure 4 tracks total merchandise trade by principal end-use (e.g., automotives or industrial supplies) in either real (chained-2017) or nominal dollars. Country-specific disaggregation is not available for these data.
FAQ
**How frequently will these data update?**
The data will be updated monthly.
**Which figures/datasets are seasonally adjusted or nominal?**
Figures 1, 2, and 3 are on a nominal non-seasonally adjusted basis. Figure 4 is seasonally adjusted and available in both real and nominal terms.
**How are goods on a U.S. Census basis different from a balance of payments (BOP) basis?**
Goods on a Census basis are adjusted by the U.S. Bureau of Economic Analysis to goods on a BOP basis to align with the concepts and definitions used in international and national accounts.
What is calculated duty? Calculated duty is the dutiable value of imports multiplied by the applicable duty rate. The dutiable value represents the percentage of the Customs value of foreign merchandise imported into the United States that is subject to a duty. The U.S. Census Bureau uses applicable duty rate(s) from the Harmonized Tariff Schedule of the United States Annotated for Statistical Reporting Purposes (HTSUSA). Note that calculated duty may over- or understate the actual duty paid due to duty-free or special rates. Duty-free consideration for goods returned after processing and assembly abroad may lead to an overstatement, while special or varied rates may lead to an understatement.
What is the North American Industry Classification System (NAICS)? The NAICS uses a production-oriented or supply-based framework, grouping establishments by similar economic activities for goods or services. It employs a six-digit coding system: the first two digits indicate the general activity category, the third marks the sub-sector, the fourth the industry group, the fifth the NAICS industry, and the sixth the national industry. The tracker presents NAICS categories disaggregated at levels two and three. The top-level categories have the prefix “(Total)” and represent the sum of each respective NAICS level three subcategory. Users interested in further disaggregation can find the full data at the U.S. Census Bureau’s International Trade API.
How does the U.S. Census Bureau generate NAICS classified trade data? The statistics are initially collected and compiled in terms of approximately 8,000 commodity classifications in Schedule B for exports and approximately 14,000 classifications in the HTSUSA for imports. These classifications are rearranged and summarized into the NAICS system.
Where can I find a glossary of terms? A glossary of U.S. Census international trade-related terms can be found here.
Where can I find a list of the area groupings (e.g., ASEAN, etc.)? More information about the area groupings can be found here.
This tool is a work in progress. For questions or suggestions, contact info@hamiltonproject.org.